Monitoring
The VectorChord Cloud provides several graphs for monitoring system and database metrics. You can access the Metrics dashboard from the cluster details in the VectorChord Cloud Console. Observable metrics include:
Storage Usage
This graph shows the total and usage of the storage of Postgres instance. 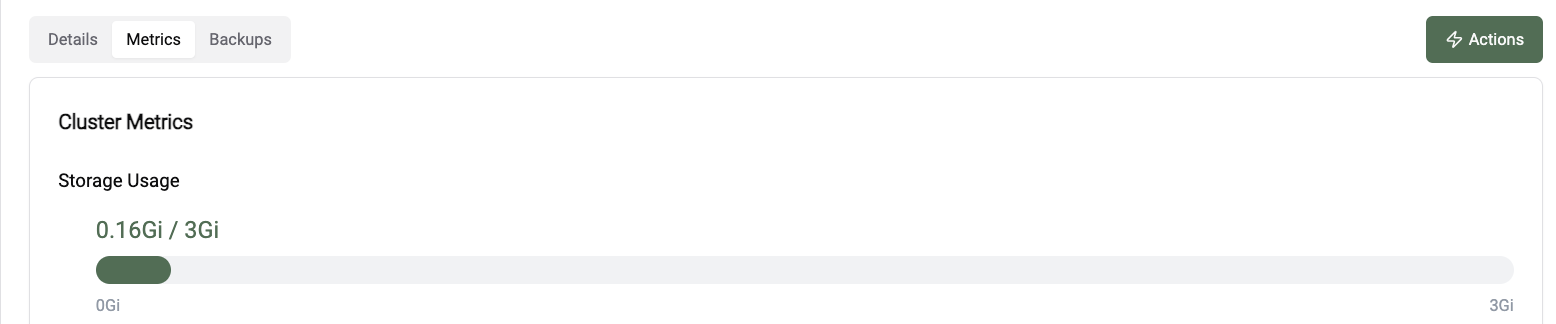
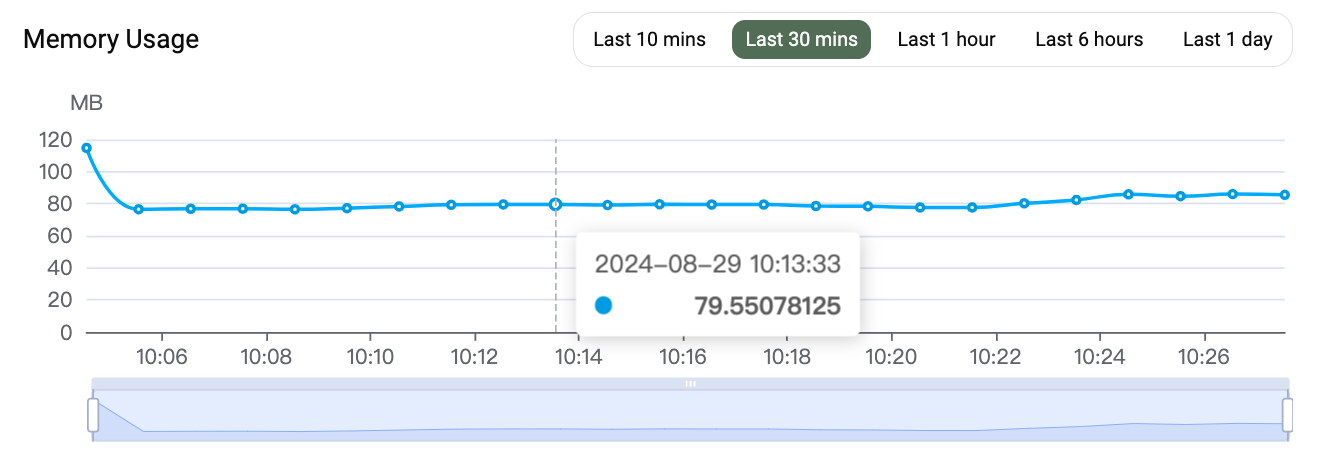
RAM
This graph shows the average memory usage of the Postgres instance, the unit is in MB.
CPU
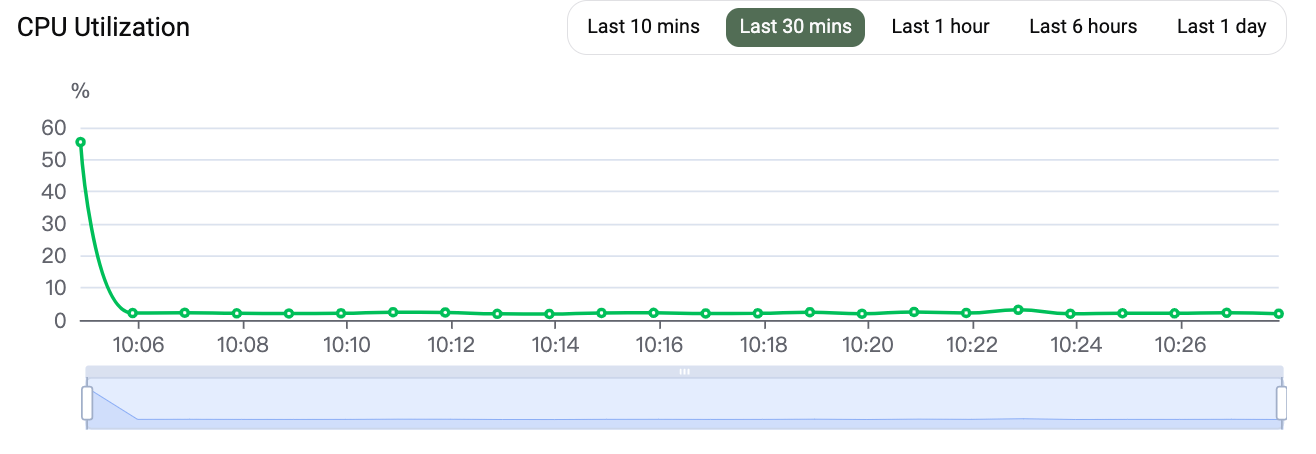
This graph shows the average CPU utilization percentage of the Postgres instance in past 5 minutes.
Vector
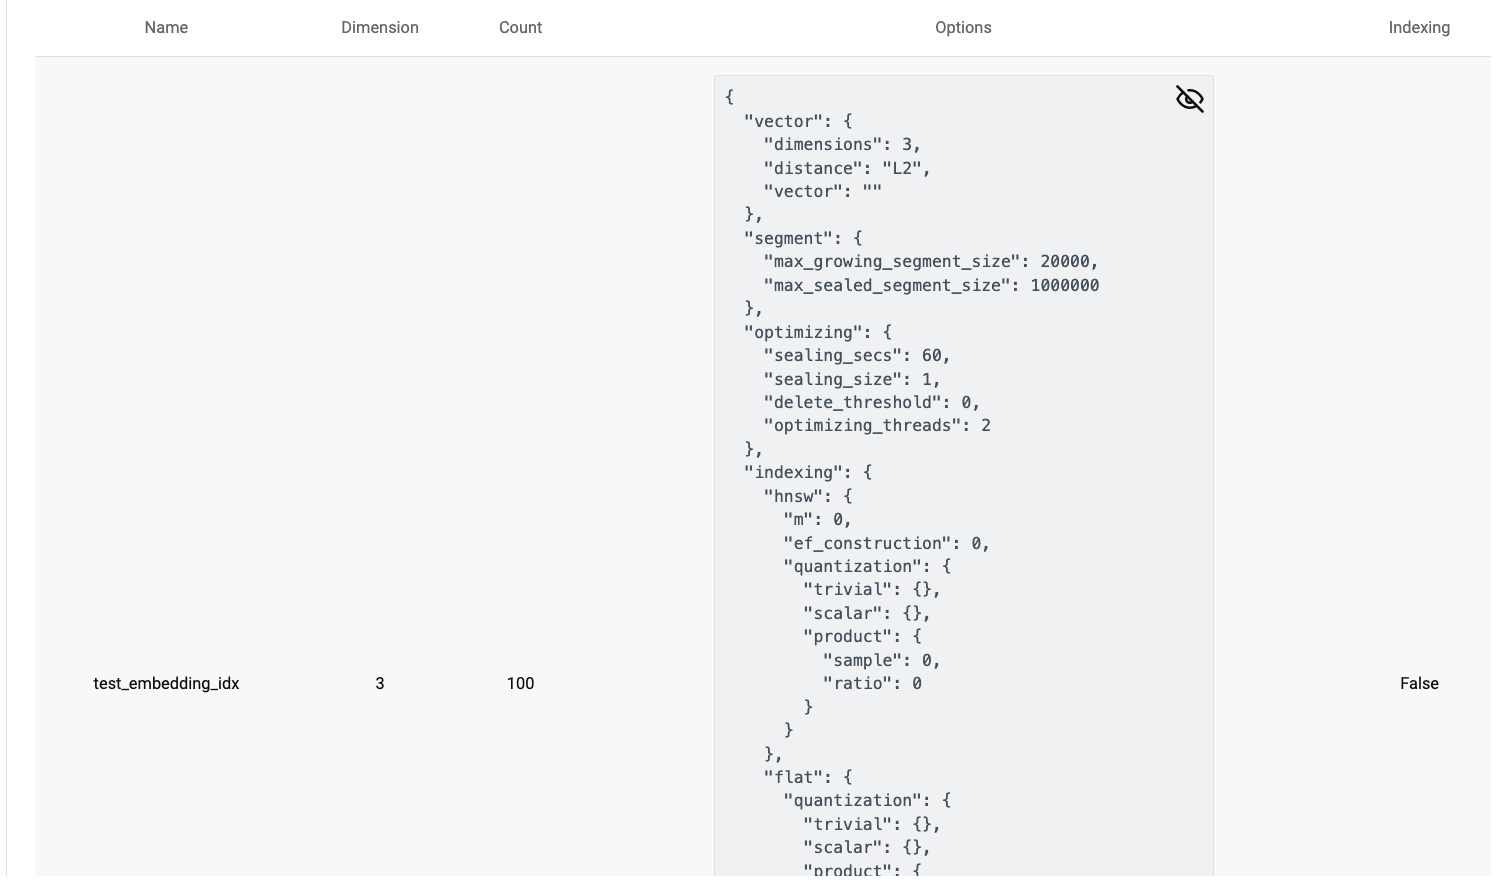
This graph shows the details of the vector index, including following metrics:
- Index Name: The name of the index.
- Index Dimension: The dimension of the vectors in the index.
- Index Vector Count: The number of vectors in the index.
- Index Options: Details of the index options can be found in the Index Options
- Indexing: If
True, it means the index is in the process of indexing the data.